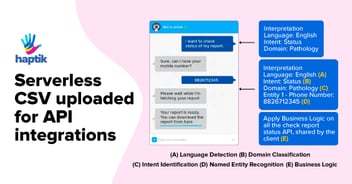
Over the last couple of years, Haptik has built and deployed 100+ chatbots on its platform. These chatbots depend on a complex backend for their functionality. Once a message is sent from the user numerous algorithms are triggered to generate a response for the user.
Frequent code addition, the large number of iterations & bug fixes often need to go live as soon as possible and helps us improve quality. Over time, we have also built a lot of micro-services to make our platform featureful.
Initially at Haptik, during a code release, we would all (4-5 people) sit together and start the release by logging into the servers, pulling the code and restarting the application one by one on each of the servers. One person would monitor the logs and check for any errors, while another would check New Relic for any application errors. Due to this complicated process, we would do releases once a week. We called it the “Release Train“, and for a single release, it took us at least a couple of hours to roll out all the code changes.
It didn’t take us long to realize that this could become a bottleneck in the speed at which we wanted to ship features to the end user. The long release pipeline was slowing our growth, with even a small hotfix taking a lot of time.
The solution to the problem is CI/CD (Continuous Integration/Deployment) & Monitoring, which more or less comprises of the following:
- 1. One click deployments and blue-green deployments for backend
- 2. An easy way to retrieve logs and get more insights into the application performance
- 3. CI tools for the mobile apps. E.g.: Bitrise & Buddybuild
- 4. Easy detection of bugs in the UAT environment
- 5. Checks for failed deployments and easy ways to rollback
- 6. Alerts for application errors
There is a lot to go through so this will be a 3 part blog. In this post I will be covering the following in brief:
- Overview of CI pipeline – Lint review, Unit tests, Integration & API testing
- Overview of CD pipeline – One-click deployments
- Overview of Monitoring and Logging
We don’t have a build & release team.
Firstly, at Haptik, the developers are in charge of their own releases. Secondly, all developers have their own EC2 machines where they can play around with the code as much as they want. Basically, every developer has the entire Haptik application suite setup for him/her and the data stays in isolation with others. So, a separate DB, Redis, Elasticsearch, etc.
As a developer, you write your code, if your tests pass, you merge your code into develop, then master and carry out the release.
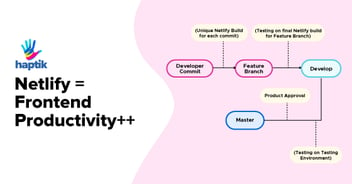
Let me dig a little deeper into merging code. We follow the git-flow. Though git-flow comes with its own trade-offs, we have adapted to it very well. Below is an image which will give you a brief understanding of git-flow.
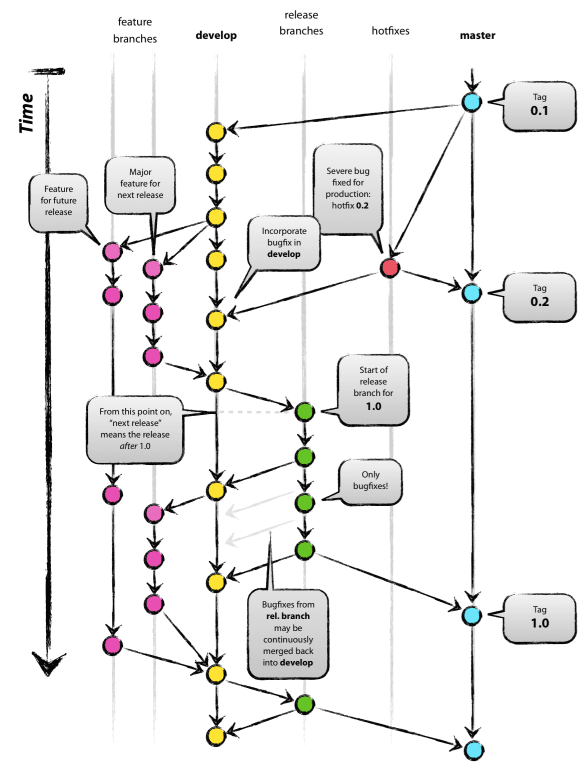
Note: For a hotfix, we create a branch from master, raise a PR, and once the test cases pass and the PR is approved, we merge our code and again do the simple Jenkins clicks.
I will be delving into the aforementioned aspects in greater detail in a future blog.
The various coding languages that we use at Haptik are:
1. Python
2. Java
3. Objective C & Swift
4. Javascript (ReactJS)
Part 1: Overview of CI Pipeline
What happens when we raise a PR against develop branch?
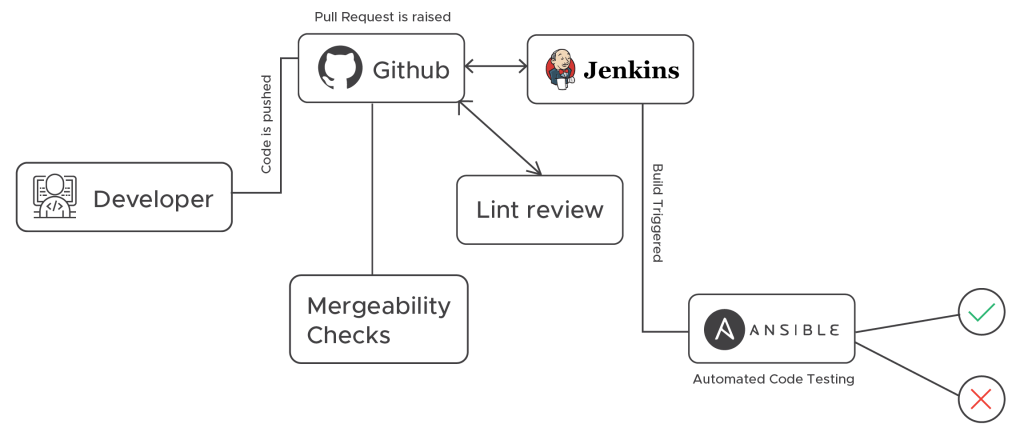
1. Once the PR is raised, GitHub makes a webhook call to our Lint server and lint-review is triggered. (Linting is the process of running a program that will analyze code for potential syntactical errors, wrong imports, & various coding standards).
2. Mergeability tests also run when a PR is raised. We iterate through various conditions like, does the PR have a label, does it have a description, is the changelog updated, etc. and post a status for the checks.
3. Along with that Jenkins is notified via a webhook and the Test cases job is triggered.
We have a Testing environment, which is a clone of our staging environment. It has all the basic components, but is mainly used just to run the test cases, in the following manner:
1. When the Jenkins job is triggered, we pull the code in the branch for which the PR was raised, and run test cases. Most of our code has been written in Python, (Django) so we simply run tests along with tests coverage report.
2. Once the test cases finish running, we grab info from the coverage files and tests output and we push these as comments on the PR. If there is a failure, the developer would easily know what to fix.
3. We also shoot an email with the errors in test suites.
4. Only once the test cases and Lint review pass is the developer allowed to merge his/her code.
5. The PR also needs to be approved by one or more team members. This is similar across all our applications and microservices. Of course for Dockerized applications, we run tests within the containers. I will explain this further in a future blog.
6. ReactJS, which powers the frontend of our Platform Suite, also has a CI pipeline with tests running during the build time. So, once the code is ready, an automated job builds the artifacts and runs the respective tests.
We are also integrating automated UI testing for this which is currently a Work In Progress.
7. For our Mobile apps, we use Bitrise for Android and Buddybuild for iOS CI.
They are fairly simple tools to get started with and provide us with a great platform enabling our Mobile apps automated testing. Once a build passes all checks, we send the build to QA team via Email for them to take care of the rest.
8. We also have a pipeline setup for any new chatbot being built on the platform. We do run this during major code release so as to do sanity. The tool is totally built in-house and is called the Bot QA tool.
So, that’s the CI pipeline for you.
Part 2: Overview of CD pipeline
How do we deploy the new code?
Once you’ve been through the CI pipeline, Jenkins is your next stop.
Deploying code at Haptik more or less means firing a few Jenkins jobs. Let us briefly discuss the process:
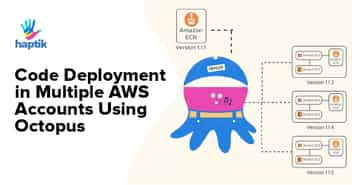
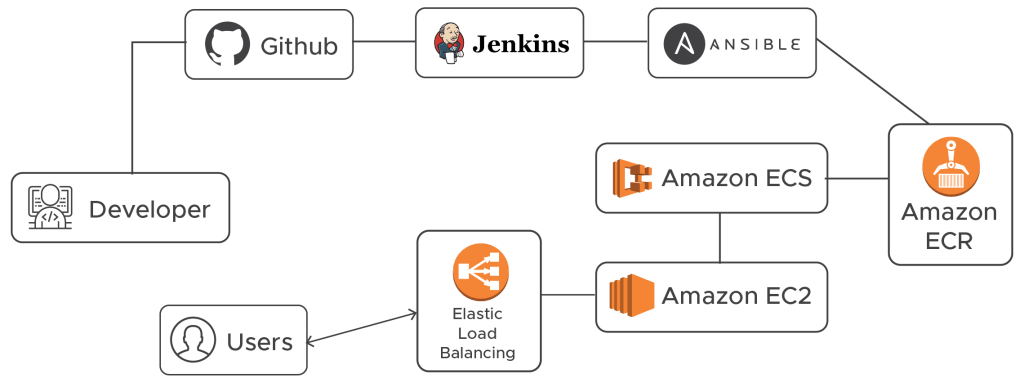
1. We have different Jenkins jobs to deploy and roll out different applications/microservices. Deploy simply means we update the code inside our Docker images, do a sanity check, push them to AWS ECR, and if everything looks fine we do a blue-green deployment with the help of Amazon ECS.
2. These Jenkins jobs in the backend trigger Ansible playbooks which take care of pulling the code, building the images, running some sanity checks and finally reporting back with a status of success or failure.
3. For Mobile applications, the step to push latest app versions to play store and App store is manual for now. We definitely do plan to automate that in the near future.
4. Frontend code also has a deployment job which builds the artifacts from the input branch and pushes the artifacts to Amazon S3 from where they are accessed globally.
5. Release Notes – We have an automated pipeline for creating release notes. As soon as PRs go into master, our release-drafter drafts a release with a new tag. It groups the PRs under different sections like Bug Fixes, New Features & Enhancements. Once a release is published, we send an email to the entire team with the changelog using an automated Jenkins job.
So, that’s the CI/CD process put simply.
Part 3: Overview of Monitoring and Logging
Last but not least.
Various application & server logs are pushed to our Logging pipeline. We use both an ELK stack & AWS Cloudwatch Logs to handle these incoming logs and make it available to the developer. If any patterns like “5xx”, “error” “exception” etc. occur in the logs, we intimate the team so that they can look into it and implement a fix for them.
Along with the logging pipeline, we have APM ( Application Monitoring) setup using New Relic agents. By making use of New Relic agent decorator in application code gives more insights into the execution of various tasks and functions.
We also have a system in place where if % of errors for any application reaches more than 1% we raise alerts and these alerts also trigger PagerDuty.
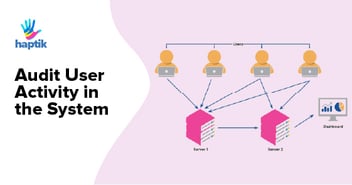
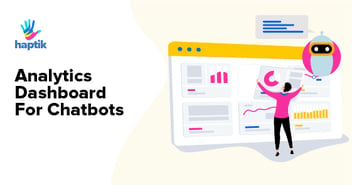
Haptik, being a chatbot company, we have also built various dashboards where users & developers can check how their bots are performing. Automation % – % of chats being handled End to End by the bot, is an important metric for us and we have alerting in place for that as well.
What have we achieved so far?
Having implemented the processes mentioned above, we have successfully reached a point where we do 20 releases a week. And the best part is no one has to wait to push their code to production. Every application has its own pipeline setup which makes the process really simple and less time-consuming. The number of bugs in production has reduced by 90% and we have been able to achieve uptime & SLAs of the range of 99.99%
Stay tuned for our future blogs where we shall discuss the following topics:
1. Continuous Integration pipeline, in-depth with all the tools we use
2. Continuous Deployment pipeline, in-depth with all tools we use
3. Monitoring, Logging & Data Lake pipelines
4. Learnings from the above 3
Do let me know in the comments how you empower the developers in your organization. Also, any feedback is welcome.
Haptik is hiring enthusiastic engineers who want to help build next-generation conversational AI. Do check out our careers page for the same.