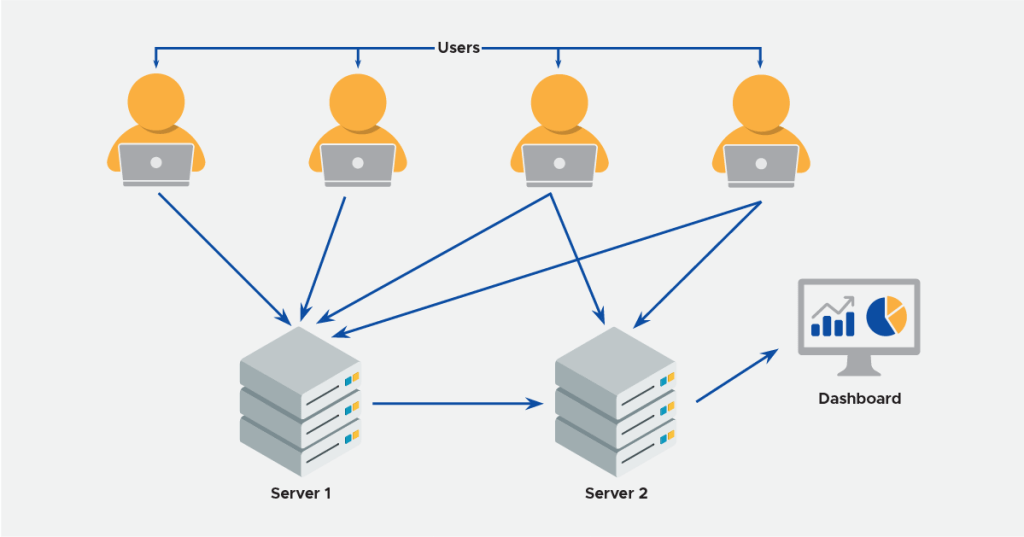
For a company to remain agile, engineers have access to multiple servers across various environments. This helps people be more independent and reduce dependencies on other teams. While this is helpful, it is important to have checks and controls in place that will prevent people from abusing this.
At Haptik, to control this we wanted to monitor all user activity on all servers. We also log all important activity happening on the platform. For that purpose, we set up a pipeline to collect logs and push them on to a common dashboard for auditing purposes. I will discuss a simple pipeline with you all in this blog.
Types of Activity Logs
1. User activity logs on servers (SSH and initiated commands, files edited, etc.)
2. User activity on our Bot Builder Platform (Who edited what)
3. User activity inside Python Shell (IPyhton logs)
Technologies Used
Ansible [v2.7]
Ansible is an open-source software provisioning, configuration management, and application deployment tool.
It just requires that systems have Python (on Linux servers) and SSH.
Filebeat
Filebeat is a lightweight shipper for forwarding and centralizing log data.
Installed as an agent on your servers, Filebeat monitors the log files or locations that you specify collects log events and forwards them to either to Elasticsearch or Logstash for indexing.
R-ELK Stack [v6.x]
R-ELK is the acronym for three open source projects: Redis, Elasticsearch, Logstash, and Kibana.
“Redis” is used as a buffer in the ELK stack.
“Elasticsearch” is a search and analytics engine.
“Logstash” is a server‑side data processing pipeline that ingests data from multiple sources simultaneously, transforms it, and then sends it to a “stash” like Elasticsearch.
“Kibana” lets users visualize data with charts and graphs in Elasticsearch.
ELK stack setup steps are present.
Pipeline
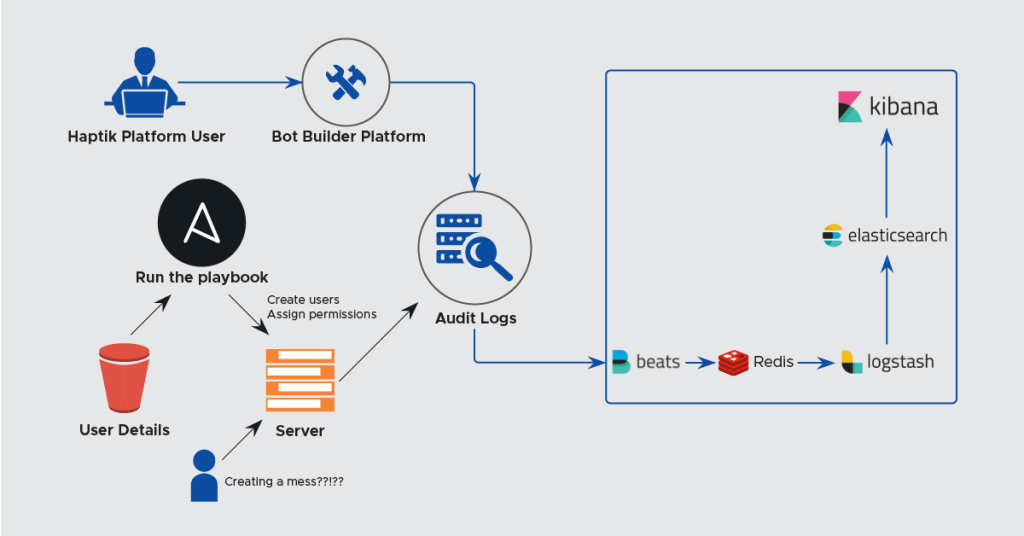
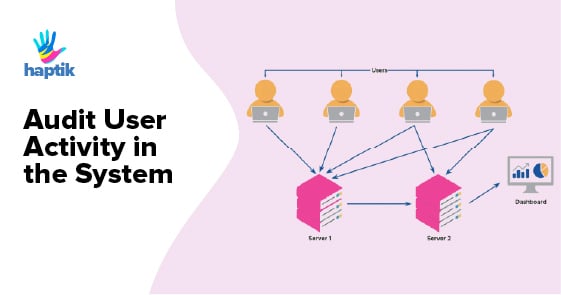
As shown in the above diagram, all the user activity data is collected and push to our central logging ELK server. Creating users for servers is controlled through Ansible and a Jenkins job that helps us do that. We also, use OpsWorks to create users on AWS machines but wanted to use a solution that is more cloud agnostic. For our platform, we have a separate permissions model. What the user does on the platform, we try to push some important types of the user activity log and helps us audit who did what. (Who made changes to what bot, some of this is still WIP).
Steps to Setup
1. User Creation on Servers
We use Ansible to manage users on all our VMs (servers). All the users that we create are added to the developer’s group.
- hosts: all connection: ssh user: ubuntu gather_facts: yes strategy: free vars_files: - users.yml tasks: - name: Add users and configure ssh access user: name: "{{item.name}}" groups: developers,docker state: "absent" shell: "/bin/bash" with_items: "" ignore_errors: yes become: true become_method: sudo - name: Add ssh keys for users authorized_key: user: "{{item.name}}" state: "absent" key: "{{item.key}}" with_items: "" ignore_errors: yes become: true become_method: sudo users: - name: prathmesh key: "ssh-rsa AAAAB3Nza....userh@haptik.com" hosts: [ "host_name" ] |
The above is available as a Jenkins job. We use it to create any user and give him/her ssh access to specified servers. The inventory file & the permissions file is maintained by us on a different reliable data store. We can control what type of access the users will have on the servers.
2. Bash History Setup
Following are the steps to consolidate bash history for all the users into a single file :
Edit the system-wide BASH runtime config file:
sudo -e /etc/bash.bashrc |
Append the following command to the end of that file :
export PROMPTCOMMAND='RETRNVAL=$?;logger -p local6.debug "$(whoami) [$$]: $(history 1 | sed "s/^[ ]*[0-9]\+[ ]*//" ) [$RETRN_VAL]"' |
Set up rsyslog based logging with a new file:
sudo -e /etc/rsyslog.d/bash.conf |
Contents:
local6.* /var/log/commands.log |
Restart rsyslog:
sudo service rsyslog restart |
Configure log rotation for the new file:
sudo -e /etc/logrotate.d/rsyslog |
Append the following to the end of that file:
/var/log/commands.log |
3. auditd Setup
Set up auditd on all the servers
sudo apt-get updatesudo apt-get install auditd |
Configure auditd rules
sudo vim /etc/audit/audit.rules |
Contents: Sample conf.
Restart auditd
sudo service auditd restart |
Some more about auditing Linux servers.
4. Filebeat Setup
- Install filebeat
Configure filebeat
#=========================== Filebeat prospectors ============================= filebeat.prospectors: - input_type: log # Paths that should be crawled and fetched. Glob based paths. paths: - /var/log/commands.log - /var/log/auth.log # - <path to python_shell logs> #-------------------------- Redis output ------------------------------ output.redis: hosts: ["<ELK_Server_IP>"] key: "filebeat" db: 1 timeout: 5 logging.level: debug filebeat.modules: - module: auditd log: enabled: true var.paths: ["/var/log/audit/audit.log"] |
2. audit logs for the application/bot platform are also written to a file on the host machines which we again push to the same ELK stack. That has a separate Filebeat which runs on each and every application server.
- Restart Filebeat:
| sudo service filebeat restart |
5. Logstash Setup
We are going to leverage Logstash from the ELK server. Following are the steps to configure Logstash for audit logs :
Create a new configuration file:
sudo vim /etc/logstash/conf.d/audit.conf |
Contents:
input { redis { host => "127.0.0.1" port => 6379 data_type => "list" key => "filebeat" codec => json db => 1 }} filter { if [source] == "/var/log/audit/audit.log" {grok {match => {"message" => ["type=%{WORD:[auditd][log][record_type]} msg=audit\(%{NUMBER}:%{NUMBER:[auditd][log][sequence]}\): %{GREEDYDATA} pid=%{NUMBER:[auditd][log][pid]} res=%{WORD:[auditd][log][res]}(\')?", "type=%{WORD:[auditd][log][record_type]} msg=audit\(%{NUMBER}:%{NUMBER:[auditd][log][sequence]}\): pid=%{NUMBER:[auditd][log][pid]} uid=%{NUMBER} old auid=%{NUMBER:[auditd][log][old_auid]} new auid=%{NUMBER:[auditd][log][new_auid]} old ses=%{NUMBER:[auditd][log][old_ses]} new ses=%{NUMBER:[auditd][log][new_ses]}", "type=%{WORD:[auditd][log][record_type]} msg=audit\(%{NUMBER}:%{NUMBER:[auditd][log][sequence]}\): %{GREEDYDATA} acct=\"%{DATA:[auditd][log][acct]}\" %{GREEDYDATA} addr=%{IPORHOST:[auditd][log][addr]} %{GREEDYDATA} res=%{WORD:[auditd][log][res]}(\')?", "type=%{WORD:[auditd][log][record_type]} msg=audit\(%{NUMBER}:%{NUMBER:[auditd][log][sequence]}\): (%{GREEDYDATA})?a0=\"%{DATA:[auditd][log][a0]}\"( %{GREEDYDATA})?", "type=%{WORD:[auditd][log][record_type]} msg=audit\(%{NUMBER}:%{NUMBER:[auditd][log][sequence]}\): (%{GREEDYDATA})?a0=%{WORD:[auditd][log][a0]} %{GREEDYDATA} items=%{NUMBER:[auditd][log][items]} ppid=%{NUMBER:[auditd][log][ppid]} pid=%{NUMBER:[auditd][log][pid]} (%{GREEDYDATA})?comm=\"%{DATA:[auditd][log][comm]}\" %{GREEDYDATA} (%{GREEDYDATA})?key=\"%{DATA:[auditd][log][key]}\"", "type=%{WORD:[auditd][log][record_type]} msg=audit\(%{NUMBER}:%{NUMBER:[auditd][log][sequence]}\): %{GREEDYDATA} acct=\"%{DATA:[auditd][log][acct]}\" %{GREEDYDATA} res=%{WORD:[auditd][log][res]}(\')?", "type=%{WORD:[auditd][log][record_type]} msg=audit\(%{NUMBER}:%{NUMBER:[auditd][log][sequence]}\): %{GREEDYDATA} res=%{WORD:[auditd][log][res]}(\')?", "type=%{WORD:[auditd][log][record_type]} msg=audit\(%{NUMBER}:%{NUMBER:[auditd][log][sequence]}\): (item=%{NUMBER:[auditd][log][item]} )?%{GREEDYDATA}"]}} mutate { remove_field => [ "message" ] update => { "type" => "auditd" } } } if [source] == "/var/log/commands.log" { grok { match => {"message" => ["%{SYSLOGTIMESTAMP:syslog_timestamp} %{HOSTNAME:syslog_hostname} %{DATA:user}: %{DATA:group} \[%{NUMBER:pid}\]:\s*%{NUMBER}\s*%{DATA:command}\s*\[%{NUMBER:command_exit_code}\]"] } } mutate { remove_field => [ "message" ] update => { "type" => "commands" } } } if ("shell_" in [source]) {#TODO#Improve the grok filters by combining them if possible grok { match => { "message" => "%{GREEDYDATA}" } } grok { match => { "source" => "%{GREEDYDATA}shell_%{DATA:user}.log" } } mutate { update => { "type" => "shell" "user" => "%{user}" } } } if [source] == "/var/log/auth.log" { grok { match => { "message" => ["%{SYSLOGTIMESTAMP:[system][auth][timestamp]} %{SYSLOGHOST:[system][auth][hostname]} sshd(?:\[%{POSINT:[system][auth][pid]}\])?: %{DATA:[system][auth][ssh][event]} %{DATA:[system][auth][ssh][method]} for (invalid user )?%{DATA:[system][auth][user]} from %{IPORHOST:[system][auth][ssh][ip]} port %{NUMBER:[system][auth][ssh][port]} ssh2(: %{GREEDYDATA:[system][auth][ssh][signature]})?", "%{SYSLOGTIMESTAMP:[system][auth][timestamp]} %{SYSLOGHOST:[system][auth][hostname]} sshd(?:\[%{POSINT:[system][auth][pid]}\])?: %{DATA:[system][auth][ssh][event]} user %{DATA:[system][auth][user]} from %{IPORHOST:[system][auth][ssh][ip]}", "%{SYSLOGTIMESTAMP:[system][auth][timestamp]} %{SYSLOGHOST:[system][auth][hostname]} sshd(?:\[%{POSINT:[system][auth][pid]}\])?: Did not receive identification string from %{IPORHOST:[system][auth][ssh][dropped_ip]}", "%{SYSLOGTIMESTAMP:[system][auth][timestamp]} %{SYSLOGHOST:[system][auth][hostname]} sudo(?:\[%{POSINT:[system][auth][pid]}\])?: \s*%{DATA:[system][auth][user]} :( %{DATA:[system][auth][sudo][error]} ;)? TTY=%{DATA:[system][auth][sudo][tty]} ; PWD=%{DATA:[system][auth][sudo][pwd]} ; USER=%{DATA:[system][auth][sudo][user]} ; COMMAND=%{GREEDYDATA:[system][auth][sudo][command]}", "%{SYSLOGTIMESTAMP:[system][auth][timestamp]} %{SYSLOGHOST:[system][auth][hostname]} groupadd(?:\[%{POSINT:[system][auth][pid]}\])?: new group: name=%{DATA:system.auth.groupadd.name}, GID=%{NUMBER:system.auth.groupadd.gid}", "%{SYSLOGTIMESTAMP:[system][auth][timestamp]} %{SYSLOGHOST:[system][auth][hostname]} useradd(?:\[%{POSINT:[system][auth][pid]}\])?: new user: name=%{DATA:[system][auth][user][add][name]}, UID=%{NUMBER:[system][auth][user][add][uid]}, GID=%{NUMBER:[system][auth][user][add][gid]}, home=%{DATA:[system][auth][user][add][home]}, shell=%{DATA:[system][auth][user][add][shell]}$", "%{SYSLOGTIMESTAMP:[system][auth][timestamp]} %{SYSLOGHOST:[system][auth][hostname]} %{DATA:[system][auth][program]}(?:\[%{POSINT:[system][auth][pid]}\])?: %{GREEDYMULTILINE:[system][auth][message]}"] } pattern_definitions => { "GREEDYMULTILINE"=> "(.|\n)*" } remove_field => "message" } mutate { update => { "type" => "auth" "user" => "%{user}" } } date { match => [ "[system][auth][timestamp]", "MMM d HH:mm:ss", "MMM dd HH:mm:ss" ] } }} output {elasticsearch { hosts => ["0.0.0.0:9200"] index => "audit-%{+YYYY.MM.dd}" }} |
As per the requirement, you can add different indexes for different data. For more understanding of output/input visit Elastic’s website.
6. Viewing it on Kibana Dashboard
Below are the steps to view logs:
1. Go to ELK server’s Kibaba URL.
2. All the logs are pushed to audit-* index on ES
3. All auditd logs are sent with type: auditd
4. All Bash command history logs are sent with type: commands
5. All Python shell logs are sent with type: shell
6. All SSH auth logs are sent with type: auth
Hope this helps you set up a similar pipeline for you as well. This is a very high-level overview of a data pipeline to collect user activity log. We have internally put more audits in place which we will share soon. You can even push these logs to archived long-term storage like AWS S3, Azure Blob Storage, etc. and this data can be fetched as and when required.
We are hiring. Please visit our careers page and let us know how you are going about maintaining security practices at your company. We will soon be back with a much detailed blog around what other practices we are following.